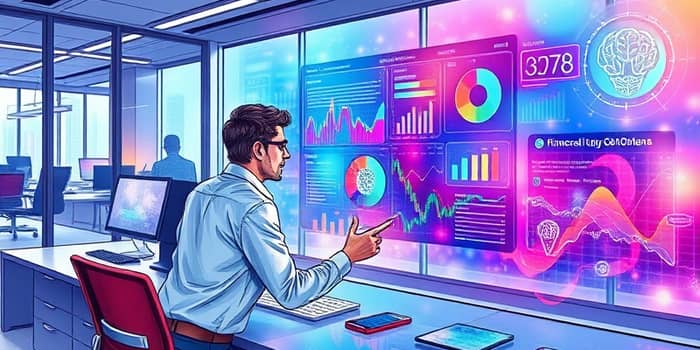
The financial world in 2026 is a tapestry of data, where complexity reigns and clarity is the ultimate prize.
Visualizing this data effectively transforms chaos into opportunity, empowering businesses to thrive in uncertain times.
Generative AI and real-time analytics are revolutionizing how we interpret financial information, making visualization a critical skill for success.
This article explores the intricacies of financial data visualization as we approach 2026.
We delve into trends, challenges, tools, and strategies to help you harness data's full potential.
By embracing these insights, you can turn complexity into a competitive advantage.
The Imperative of Data Visualization in 2026
Data visualization is no longer a luxury; it is a necessity for survival in modern finance.
With markets growing more volatile and data volumes skyrocketing, clear visual insights are key to informed decision-making.
The global data analytics market is projected to reach 420 billion dollars by 2026, highlighting its immense value.
This growth underscores the need for advanced visualization techniques to process and present financial data.
Key statistics reveal the shift towards data-driven finance:
- 60% of repetitive data management tasks will be automated by 2027, as per Gartner.
- Privacy laws now apply in over 140 countries, demanding robust governance.
- 75% of enterprise data will be generated at the edge by 2025, enabling real-time processing.
- 80% of employees will access insights directly from business apps in 2026.
- Organizations with real-time insights are 1.6 times more likely to achieve double-digit growth annually.
These numbers illustrate why visualization is integral to navigating financial complexity.
Key Trends Shaping Financial Data Visualization
Several transformative trends are redefining how financial data is visualized in 2026.
Real-time data and streaming have become standard, with technologies like Kafka enabling instant fraud detection.
This allows for dynamic pricing and predictive maintenance in milliseconds, revolutionizing financial operations.
Analytics everywhere and self-service BI empower users at all levels with tools like Power BI and Looker.
Natural language querying makes data accessible to non-experts, fostering a culture of data literacy.
Other pivotal trends include:
- Augmented analytics and GenAI: Automating insight generation and narrative creation for faster decisions.
- Data fabric and data mesh architectures: Ensuring consistent governance across distributed systems.
- Democratization with AI: Allowing everyone to query data in plain language, breaking down barriers.
- Data marketplaces: Facilitating data sharing for new revenue streams in finance and retail.
- Lineage and metadata visualization: Providing traceability for compliance in regulated financial environments.
These trends demand sophisticated visualization approaches to handle increasing data diversity.
Overcoming Challenges in Data Visualization
Despite advancements, significant challenges persist in financial data visualization.
The data paradox of uncertain ROI often leaves organizations struggling to justify tech investments.
Regulatory hurdles, with privacy laws spanning the globe, add layers of complexity to data handling.
Common challenges that hinder effective visualization include:
- Metric inconsistencies between departments, such as differing revenue definitions in finance and marketing.
- Cloud cost management issues, leading to bill shock without proper governance frameworks.
- The need for human oversight in automated processes, emphasized by financial directors in 50 countries.
- Geopolitical risks and economic volatility, which can destabilize data sources and trends.
- Balancing automation with critical human judgment in high-stakes financial decisions.
Addressing these requires a strategic, holistic approach to data management and visualization.
Essential Tools and Technologies for Success
To tackle these challenges, leveraging the right tools is crucial for effective financial data visualization.
Power BI leads with next-generation dashboards and AI-assisted insights, offering 15 best-practice examples.
This tool transforms raw data into dynamic and interactive visual stories that drive action.
Other powerful technologies include:
- Looker and ThoughtSpot: Providing headless BI capabilities for seamless data integration.
- Snowflake Data Cloud and Databricks: Enabling data sharing and collaborative analytics across platforms.
- AI platforms like Einstein from Salesforce and Copilot for Sales: Enhancing decision-making with propensity scoring.
- Visualization software that supports real-time data streams and augmented analytics features.
These tools empower organizations to create compelling visualizations that simplify complexity.
Practical Strategies for Effective Preparation
Preparing for 2026 requires actionable strategies to optimize financial data visualization.
Start by prioritizing measurable ROI in all data initiatives, a key demand from modern CFOs.
Link every visualization project to tangible business outcomes like revenue growth or cost savings.
Effective strategies to implement include:
- Developing a 12-month roadmap focusing on financial forecasts, regional analyses, and strategic investments.
- Identifying 10-15 gold metrics with clear ownership to ensure consistency and accountability.
- Scaling data efforts departmentally to align with organizational goals and foster collaboration.
- Treating data as a product with SLAs, quality standards, and easy discovery mechanisms.
- Balancing automation with human oversight in critical financial processes to mitigate risks.
- Investing in training for financial talent on data science and visualization tools to build internal expertise.
These steps create a robust foundation for leveraging data in complex environments.
Economic Perspectives and Market Insights for 2026
Looking ahead, economic trends offer valuable insights for financial data visualization needs.
Equity markets are expected to see gains of 12-15% in 2026, with U.S. earnings expanding beyond AI.
Dynamic growth in regions like Latin America and the Eurozone adds to the complexity, requiring nuanced visual analysis.
Key visualizations for financial markets that are critical include:
- VXF/SPY charts for analyzing U.S. market breadth and leadership trends.
- Inter-market ratios to identify emerging or fading trends in global finance.
- Consumer discretionary vs. staples charts, which serve as leading indicators for S&P 500 performance.
To summarize how trends impact visualization, consider this comparative table:
This table highlights strategic alignments for effective visualization in 2026.
Conclusion: Embracing the Future with Confidence
Financial data visualization in 2026 is about transforming complexity into clarity and opportunity.
By understanding key trends, overcoming challenges, and leveraging the right tools, organizations can unlock actionable insights that drive sustainable growth.
Start today by assessing your current capabilities and building a tailored strategy for the evolving landscape.
The journey to data-driven excellence begins with a commitment to visualization mastery.
Referencias
- https://www.deloitte.com/latam/es/about/recognition/news/tendencias-financieras-para-2026.html
- https://blog.bismart.com/tendencias-datos-2026-empresas
- https://www.apd.es/perspectivas-economicas-y-financieras-2026/
- https://www.santanderassetmanagement.com/es/insights/informe-de-mercado-anual-2026
- https://es.investing.com/analysis/5-graficos-que-definiran-los-mercados-en-2026-200480377
- https://insightdigital.substack.com/p/el-dinero-real-2026-fracturas-estructurales
- https://www.ieb.es/el-panorama-de-los-mercados-financieros-en-2026/
- https://www.blackrock.com/es/profesionales/vision-de-mercado/blackrock-investment-institute/publicaciones/outlook
- https://www.estrategiasdeinversion.com/analisis/bolsa-y-mercados/el-experto-opina/cual-sera-la-tendencia-de-los-mercados-en-2026-n-876377
- https://www.dost.io/es/ebooks/informe-de-situacion-y-tendencias-de-los-departamentos-financieros-en-espana-2026